May 27, 2020, 12:02am EDT

Research Firm:
Market’s Risk Is Phenomenally High, 2nd Dive Likely
Lawrence Carrel, Contributor

Equity Risk Sciences’ Market Risk Indicator (MRI) measures risk. An MRI between 0 and 50 (the green zone in the chart above) means that over the next 2.5 years, the S&P 500 should see an average return greater than 30%. An MRI greater than 90, the red areas, is the danger zone. Over the past 30 years, after the MRI hits the danger zone, the S&P 500’s return over the next 2.5-years has averaged a negative 30%.
-Equity Risk Sciences
With S&P 500 Index up more than 30% from it’s March 23 lows, it appears Wall Street has decided that the Coronavirus Bear Market of 2020 is over and let’s get back to making money. But, a sizeable segment of the investing public fears that another shoe is waiting to drop.
Although there’s still no vaccine for the virus, unemployment is hitting Depression-era levels and gross domestic product (GDP) tumbles, the stock market says, “Happy Days are Here Again!”
Equity Risk Sciences, a big-data analytics firm in Warwick, R.I., says the four-letter word on Wall Street is “risk”. The firm created a system to measure the market’s level of risk by watching 12 ratios to quantify the strength and durability of nearly every company in the U.S. It looks at the five-year trends of price-to-sales, debt-to-revenue, debt-to-tangible-equity, liquidity, and cash as a percentage of current liabilities, plus some proprietary algorhythms.
“Our system is designed to identify a reliable estimate of a company’s minimum value. Anything over that is risk,” say Raymond Mullaney, founder and chief executive of Equity Risk Sciences. He defines risk as the difference between minimum value and the current share price. For example Apple AAPL (AAPL) is trading at about 11 times minimum value.
“I can’t tell you what the market’s going to do, but I can tell you that when people pay 10 times the value of a company’s equity, they usually lose money,” said Mullaney.
Through back testing, the firm measured risk over the past 30 years in 30-month (2.5-year) increments. Each day it creates a Market Risk Indicator (MRI), a risk score between zero and 100. Zero is the safest place in terms of risk. Anything above 90 means the probability of positive returns is extraordinarily low.
An MRI between 0 and 50 (the green zone in the chart above) means that over the next 2.5 years, the S&P 500 should see an average return greater than 30%. An MRI greater than 90, the red areas, is the danger zone. Over the past 30 years, after the MRI hits the danger zone, the S&P 500’s return over the next 2.5-years has averaged a negative 30%.
Before the bursting of the dot.com bubble, the MRI for the S&P 500 was 94. In 2007, before the Fiscal Crisis, the market’s MRI was 107. In the run-up to the coronavirus crash the MRI was 119, significantly higher than 13 years ago. After the market’s two-month bounce, as of Tuesday, the MRI had dropped to only 110, still higher than the fiscal crisis.
Mullaney thinks this is a dead-cat bounce.
“I can be very emphatic. A conservative investor should still get out of the market,” said Mullaney. “That is phenomenally high risk, way higher that it was in 2007.” He said it’s a market likely to fall again.
The firm looks at a company’s stability, durability and degree of solvency, which is its ability to withstand a deep recession.
“I can tell you that most of the largest 500 companies need help, very few have balance sheets strong enough to withstand a recession,” said Mullaney. “That’s why we believe the market is risky. A lot of them have been taking on debt and borrowing money to buy back their shares.”
While management pushed up the share price, making shareholders happy, the shrinking share count made companies less durable.

Over the past few years, companies with low credit ratings have been taking advantage of low interest rates to issue a lot of debt. If they couldn’t issue more debt, they would probably go under. These are zombie companies issuing debt because people want the yield. Companies that go deeper in debt every year end up failing.
A prime example is Hertz (HTZ). In December 2013, Hertz’s shares traded at $98, and its Financial Risk Indicator (FRI, an MRI for an individual company) was 101. At the end of 2019, it was still 101, extremely high risk. On Friday, the rental car company filed for Chapter 11 bankruptcy protection after years of being highly leveraged and illiquid, making it vulnerable to collapse from a decline in sales, which the coronavirus delivered.
Mullaney points to the airlines and hotel chains, which he said can’t borrow money because they are leveraged into oblivion. “It’s not a coincidence that the government has to bail them out. If they had assets they could borrow against, real tangible net worth, then they could go to a bank and borrow.”
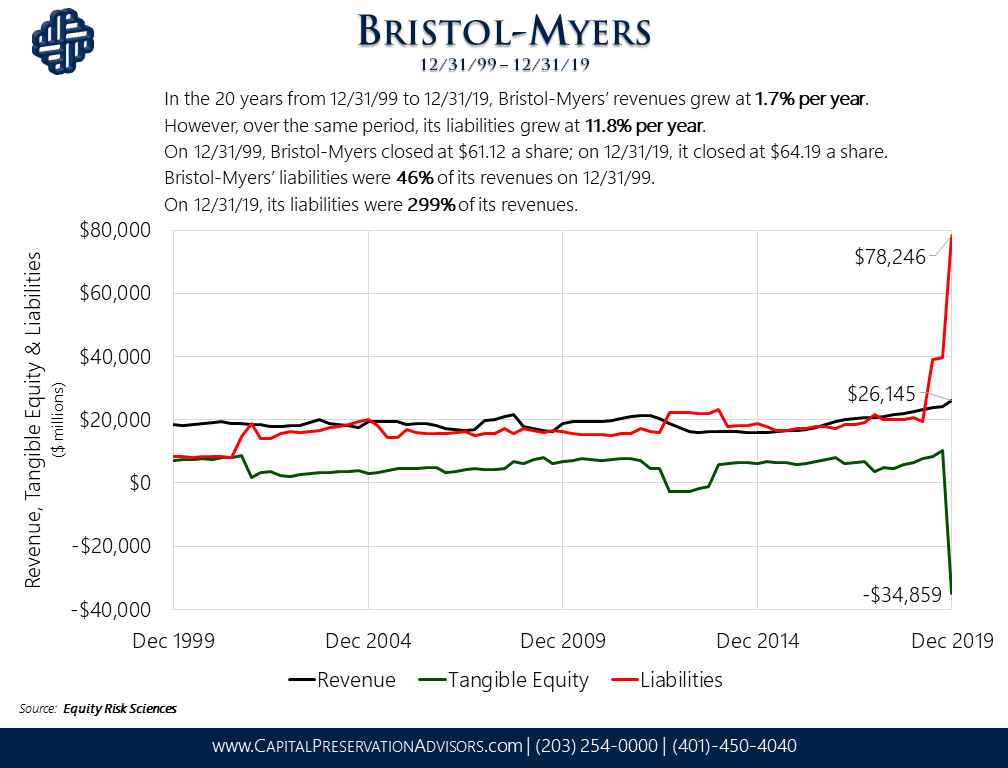
According to Equity Risk Sciences, Bristol-Myers Squibb BMY (BMY) is a high-risk company that has over borrowed, giving it a Financial Risk Indicator (FRI, an MRI for an individual company) of 95 and a Price Risk of 92. Over the 20-year period from 12/31/1999 to 12/31/2019, the drug company’s revenues grew an average of 1.7% per year, yet liabilities grew an average of 11.8% per year. At the beginning of the period liabilities were 46% of the drug company’s revenues and the share price was $61.12. By 2020, liabilities were 299% of its revenues and the share price had barely moved to $64.19. More dramatically, in the first quarter of 2019, total liabilities were $19.5 billion. Over the course of the year, they grew threefold to $79.3 billion. Mullaney said if revenues decline, the company would have trouble managing its debt.

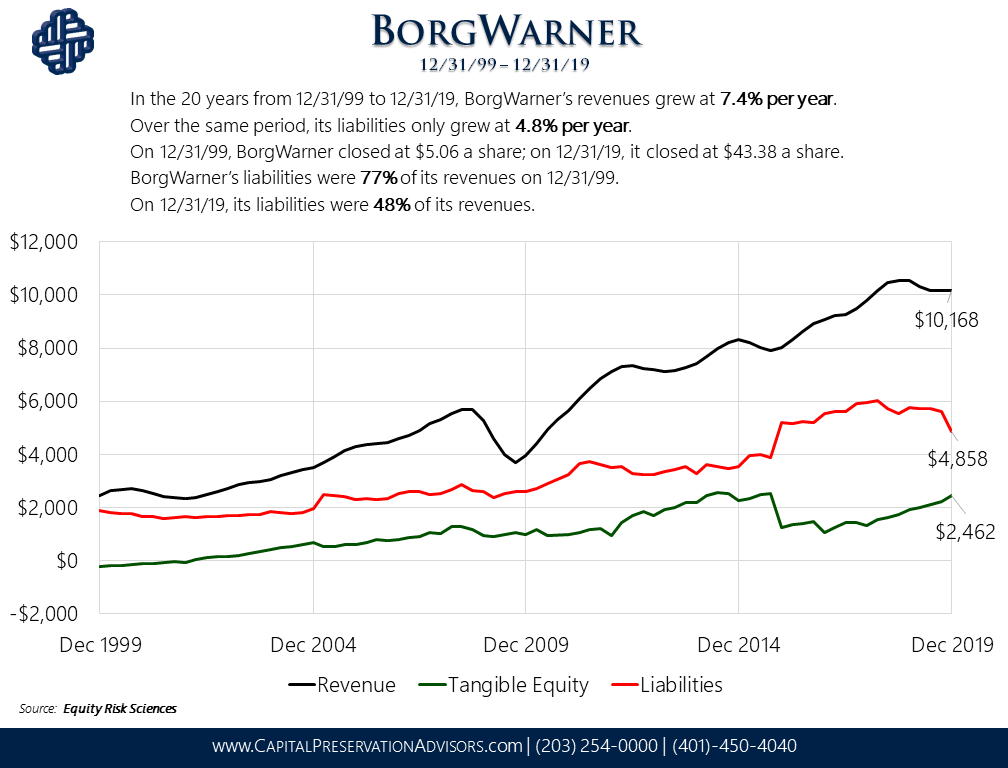
Meanwhile, a fundamentally strong company with an extremely low risk profile is Borg Warner (BWA). For the 20 years from 1999 to 2019, BorgWarner BWA ’s revenues grew an average of 7.4% per year and liabilities at a rate of 4.8% per year. In 1999, liabilities were 77% of revenues and fell to 48% of its revenues by 2019. On 12/31/99, BorgWarner closed at $5.06 a share. Twenty years later it closed at $43.38.
In the first quarter of 2019, cash was $494 million and long-term debt was $1.9 billion. A year later cash nearly doubled to $901 million and long-term debt has fallen to $1.66 billion. With an FRI of 22 and a price risk of 15, Mullaney calls this, ”Very boring but solid and cheap. Unless we have a devastating blow to the economy, it’s very undervalued.”
This article was originally posted on Forbes. Click here to view the original.
